Freeboard is a cloud based free service that allows you to display your sensor (IOT) data in a pretty way. However to display your data on freeboard you will have to Dweet your sensor values. So before you start reading this story I urge you to read the previous stories that discuss Dweet in depth. You can find those stories in the following links:
Dweet - A volatile IOT Cloud service
Dweet again - Have your ESP8266 send data to Dweet with ESPBasic
Dweet with Android - Design an APP to use Dweet on your Phone
Dweet with Raspberry - Completing the line you can dweet now from any device
As you recall from these stories we can send data to Dweet and retrieve it again as text. This can be very usefull however most of the time you would like your data to be presented in a nice graphical way. That is where Freeboard comes in. Freeboard is a service that present the data from Dweet in a nice graphical way. When I tested Freeboard and wrote this story the service was free to use. Bad thing is that Freeboard is no longer free. A paid account is required. However you can try and use it for a month for free. Within this month you may decide wether you find it worth it.
There is a way to achieve the same as described here with Node-Red. And Node-red is free to use. You can build a Freeboard-like server with a Raspberry Pi and Node-Red. This is something I will adress in a future story.
First step is to go to the Freeboard.io website and register for a account.

Pressing START NOW brings you to the page where you can register for an account. If you already have an account you can SIGN IN on the top right side of the screen.
On the next page you can choose to alter your account settings and have the option MY FREEBOARDS. When this is your first time working with Freeboard choose for creating a new board. I called it My Home.
At first you have an empty screen.
This is where all the data will be displayed
As said before, Freeboard displays data that is Dweeted. Therefore you need first to Dweet some data. In the stories about Dweet I showed you how to do that. You can now Dweet some fake data. You can also use the values from my personal thermometer. I told you thermometers are stupid, however usefull for testing purposes......... So let´s have a look at my thermometer Dweets. My ´Thing´ is called Lucstemp2018 and the thermometer value is in the variable `temp´. Let us use that.
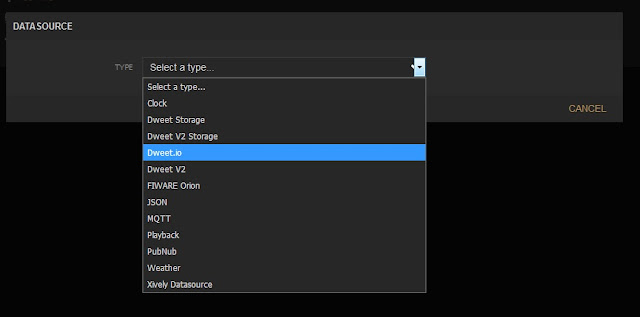
The first thing to do is to tell Freeboard where the data is coming from. On the top right side of your screen where it says DATA SOURCES click on ADD
Choose Dweet.io
Now give this datasource a name. I called it (obviously) thermometer and fill in your things name. And save.
For my thermometer I am going to make two graphical presentations. First a Gauge and second a line diagram.
Start by clicking on the left top side of the screen on ADD PANE. As you can see a new pane has been added to the screen.
You can click it and move it around on the screen to place it where you want it. For now let is be where it is.
Click on the wrench so you can edit the basic information for this pane. As the title I chose Mancave Temperature and did not alter the number of columns.
Now press the + sign and a screen opens in which you can enter the details of your widget. Choose Gauge.
Fill in the details on the Gauge. I named it Actual Temperature. In the value field click on the line next to it: Datasource and you will be presented by the name of your 'thing' and the data from it (temp). For units I choose Degrees C and as Minimum and Maximum values I choose -5 and 60. Choose SAVE again and that's it.
As you can see the Gauge is displayed immediately. And as you can see it is not very hot in my work room.
Now let's add the actual time to this information board.
Start with Adding a DATASOURCE (top right side of your screen) and choose Clock.
Fill in the details. I just called it time and left the refresh rate at every second. Save.
Now add a pane again. You can see on the top right side of the page which data sources are accessible at this moment (Thermometer and Time).
Click on the wrench of this pane to give it a name.
Choose text
Again fill in the details of this data source. Give it a name and the size you want it displayed. And use as DATASOURCE the just added TIME and use 'full string value
And there you are. You can actually see when I wrote this story........
Now let us move back to the MANCAVE TEMPERATURE pane and press on the + sign.
As type choose sparkline.
And fill in the details. I gave it the title TEMPERATURE HISTORY and as data source I used the same Thermometer and the variable 'temp'
And as you can see after a while a nice diagram is showing that displays the temperature over time.
Rests only one last possibillity.
Remember the sory about how you could PING IP adresses to see if a network attached device is working or if someone is at home ??? Well re-read the sory here.
https://lucstechblog.blogspot.com/2019/08/dweet-again.html
In that sory we added a line to the PING program to Dweet the information. Well we are going to pick that info up and display it on our freeboard.
tosend$ = "dweet.io/dweet/for/Lucshome?therm="&str(therm2)&"&domo="&str(domo2)&"&lucphone="&str(lucphone2)&"&elsphone="&str(elsphone2)
a$= wget(tosend$,80)
These were the lines in our basic program that send the information to Dweet.
So thing 'thing' is called Lucshome and the variables are therm, domo, lucphone and elsphone.
What I want is just a simple indicator that displays wether the Thermometer is working, Domoticz is working and wether me or my girplfriend are at home.
First add a new DATASOURCE

Again use Dweet.io as the type, and Lucshome as the name of the 'thing'
Now make a new pane. I called it "Who is at home"
Add a widget and choose Indicator light as the type.
Fill in the details.
The widget will indicate if I am at home or not. So I called it "Where is Luc". The DATASOURCE is the just added "Who is at home" and the variable is "lucphone".
In the same pane click again on the + sign and add another widget. This time for Els'es phone.
And as you can see we have now 2 indicator lights that show wether Els and I are at home.
And that's about it.
There are many more possibillities with Freeboard. You can add a Google Map with location details, add pictures, add a pointer that works like a compass, add text and HTML code. So you can have a lot of widgets on your screen. And as you saw in the example above. You can have information from multiple ESP's on your screen. Did you know by the way that you can also Dweet with a Raspberry. That opens even more possibillities.
And best of all you can have multiple boards on one account. So you can make boards for your home, work, garden, aquarium etc etc etc.
Privacy, what privacy ??
Well as you have learned from the Dweet stories: everybody can see your data when they know your 'things'name. There is however so much data Dweeted every moment that, when you choose a secret 'thing' name it will be difficult to find your specific data.
Freeboard needs you to log in to alter the boards and widgets.
However when a board is finished or being build you can see in the URL of your browser the ID of the board.

So if anyone is looking over your shoulder when you are building your board and notes down the URL he can look at your board without having to log in. So be carefull what information you give/show to who.
Till next time.
Have fun
Luc


